Dashboard Overview
The Statsy Dashboard provides a centralized location to manage and analyze your sites' analytics data, with access to various features and settings. This article will give you an introduction to the different components of the Statsy Dashboard.
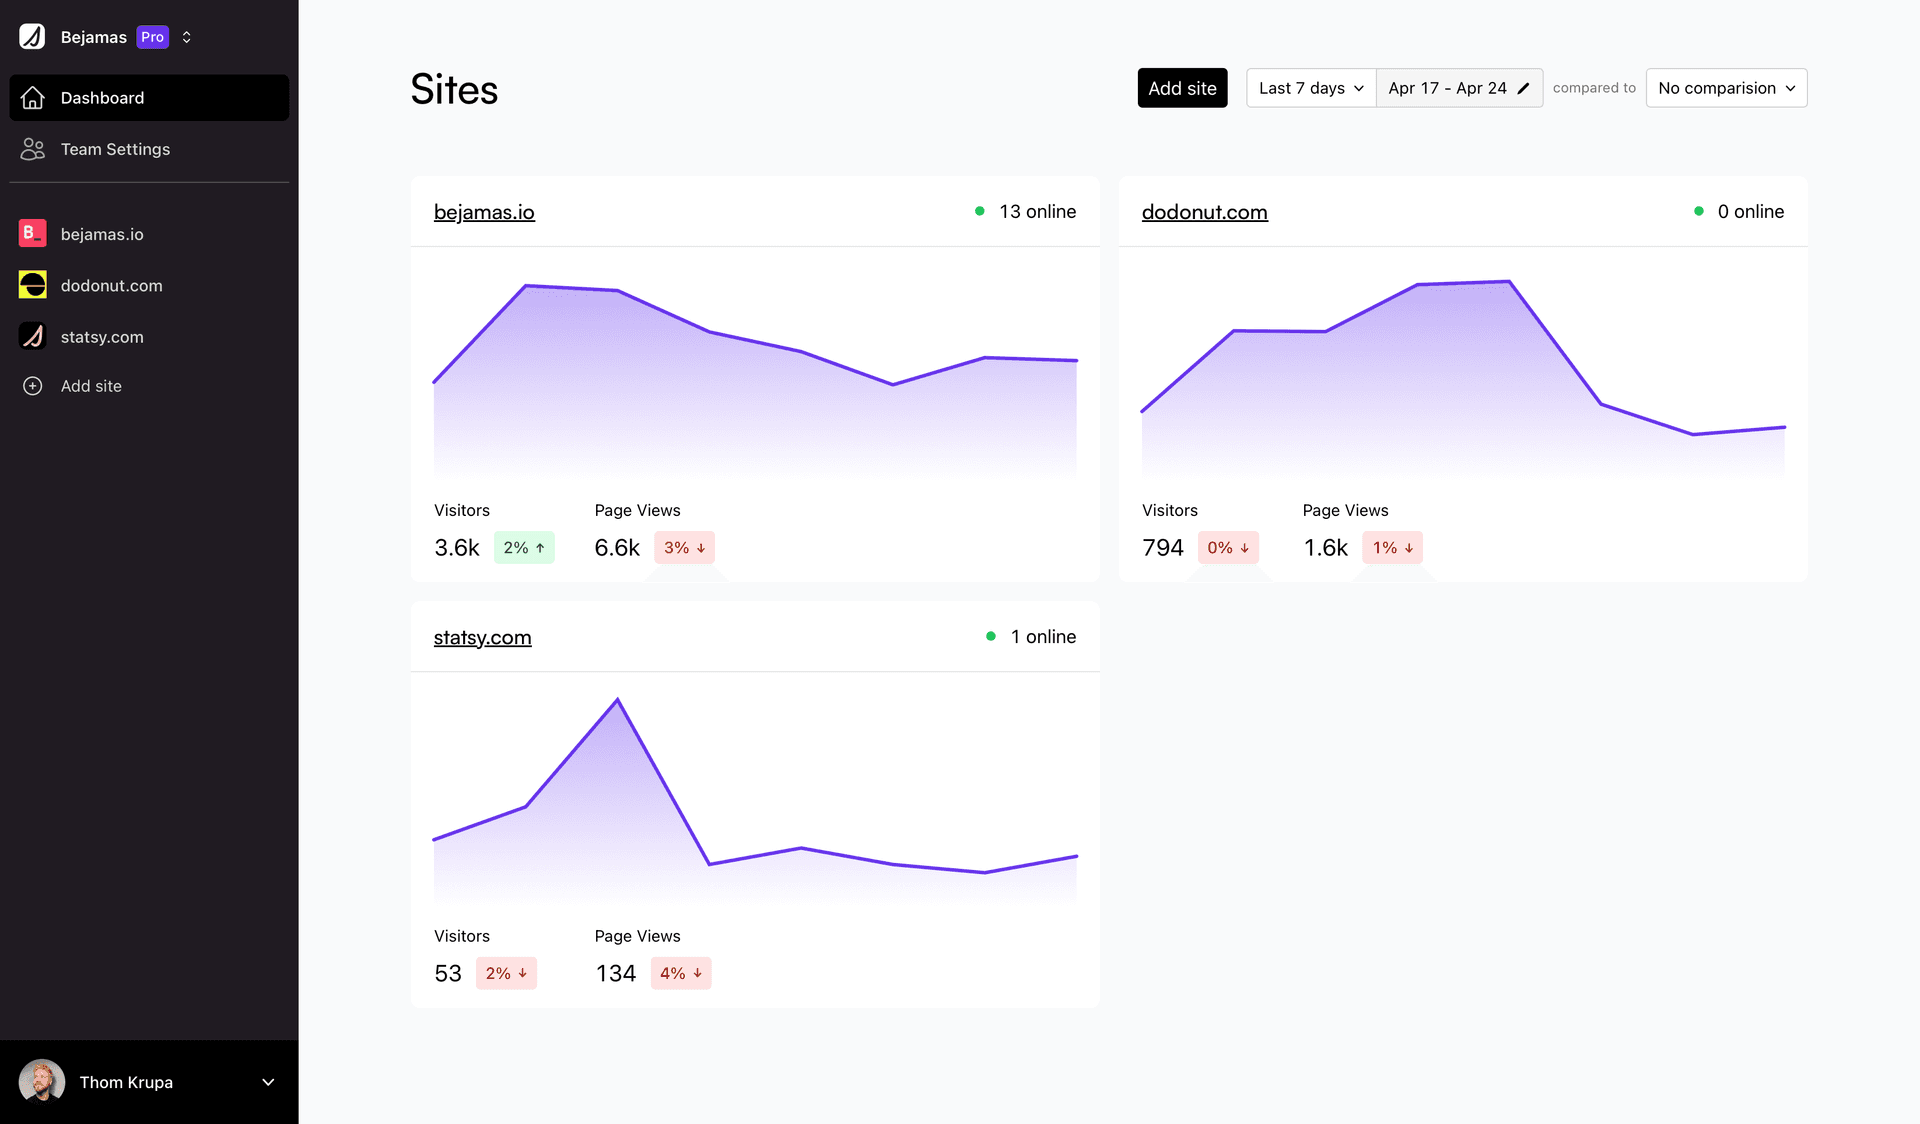
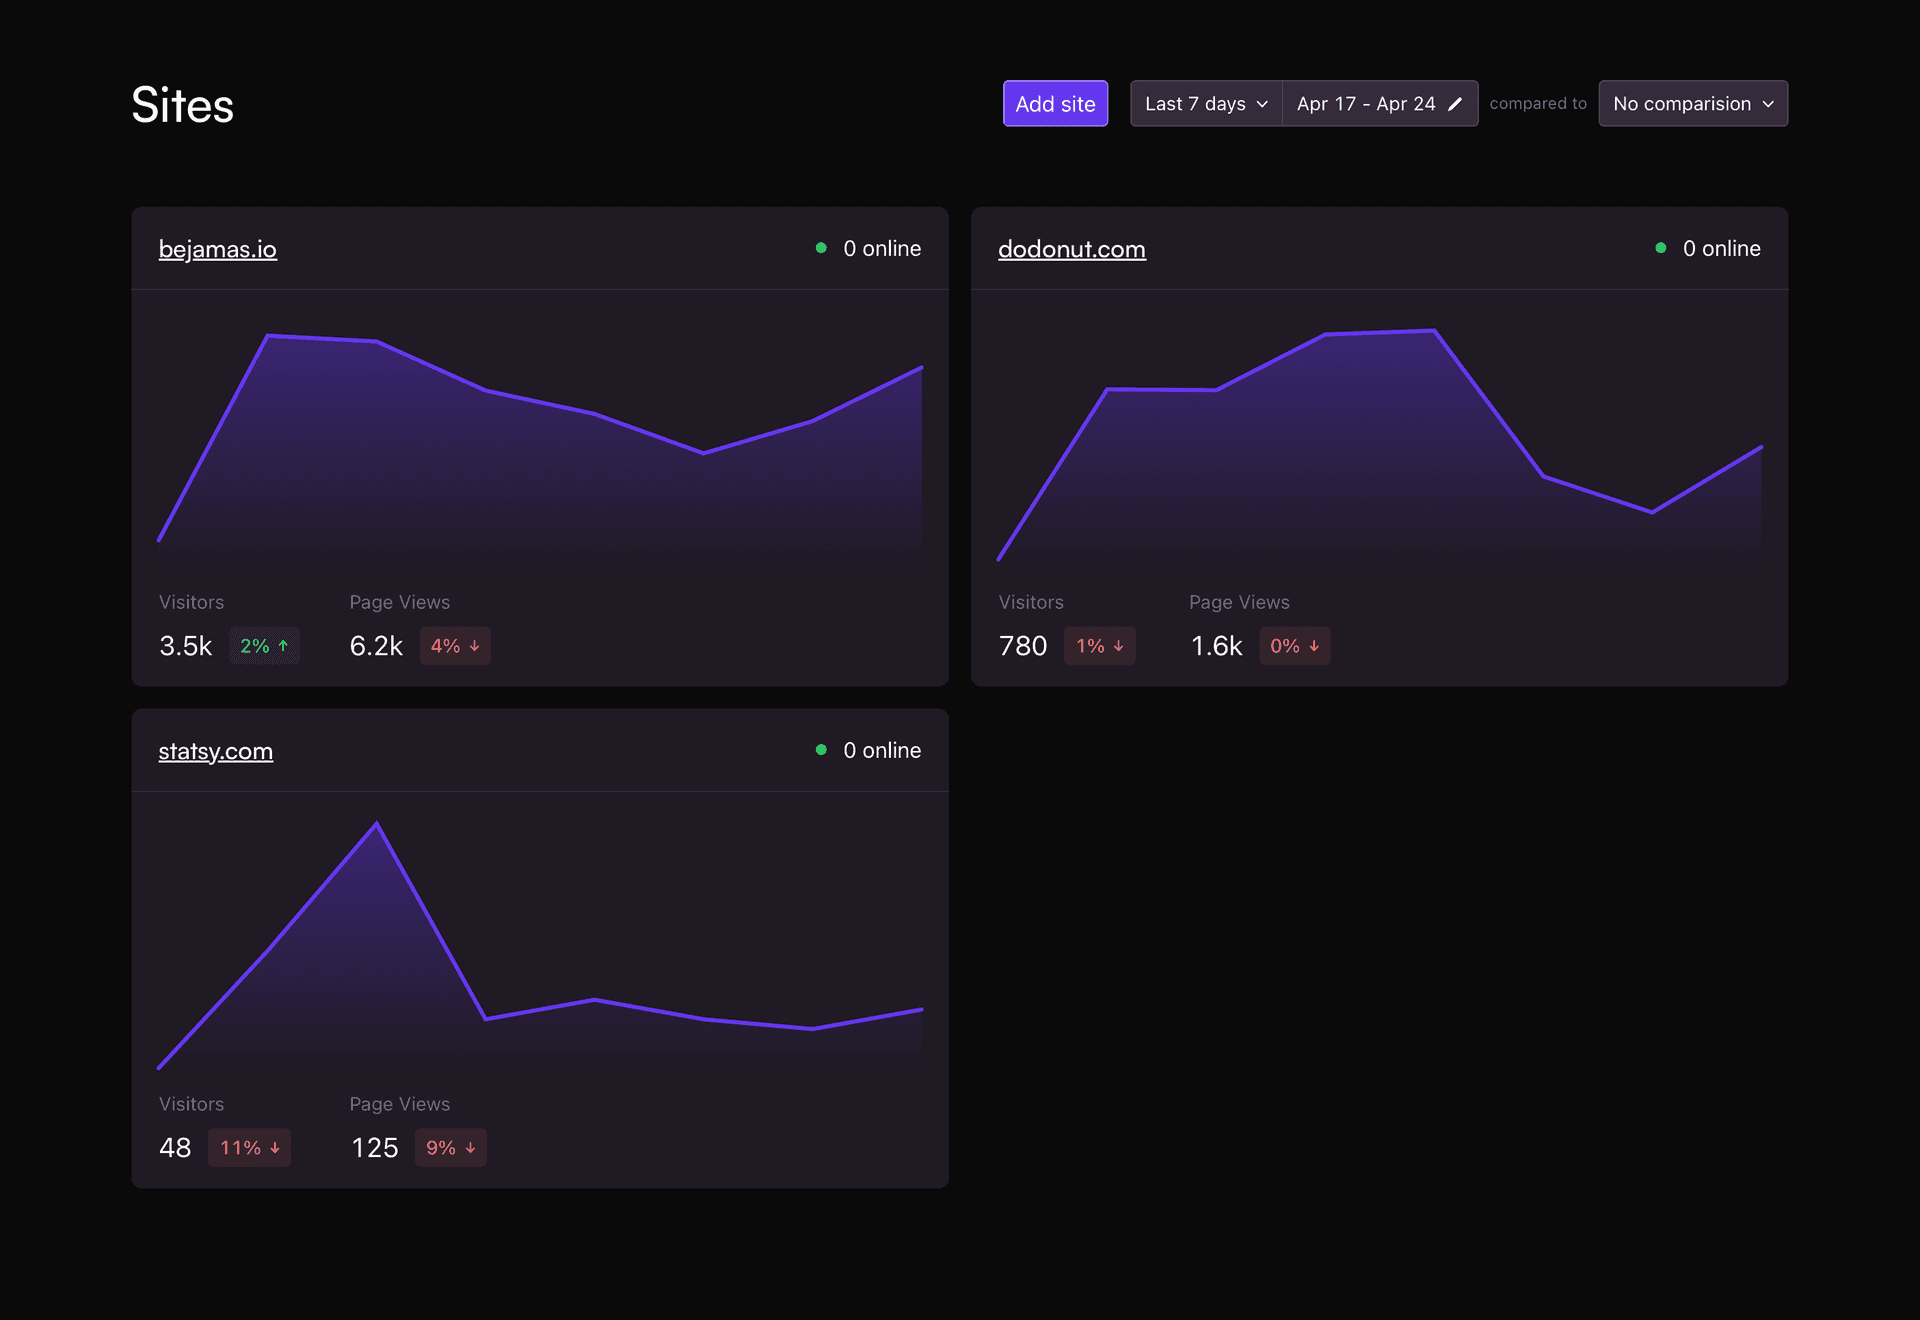
You'll also see the current numbers of visitors and a chart for the selected date range.
If you click on a site, you'll go to the site dashboard which includes all meaningful stats for that site.
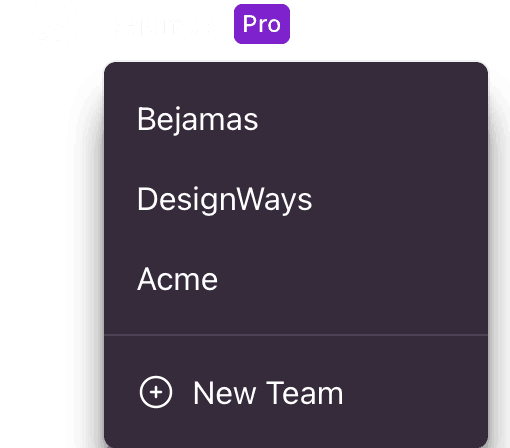
Teams Switching
Dropdown located in the top left corner, allows you to switch between different teams and access the associated sites and settings.

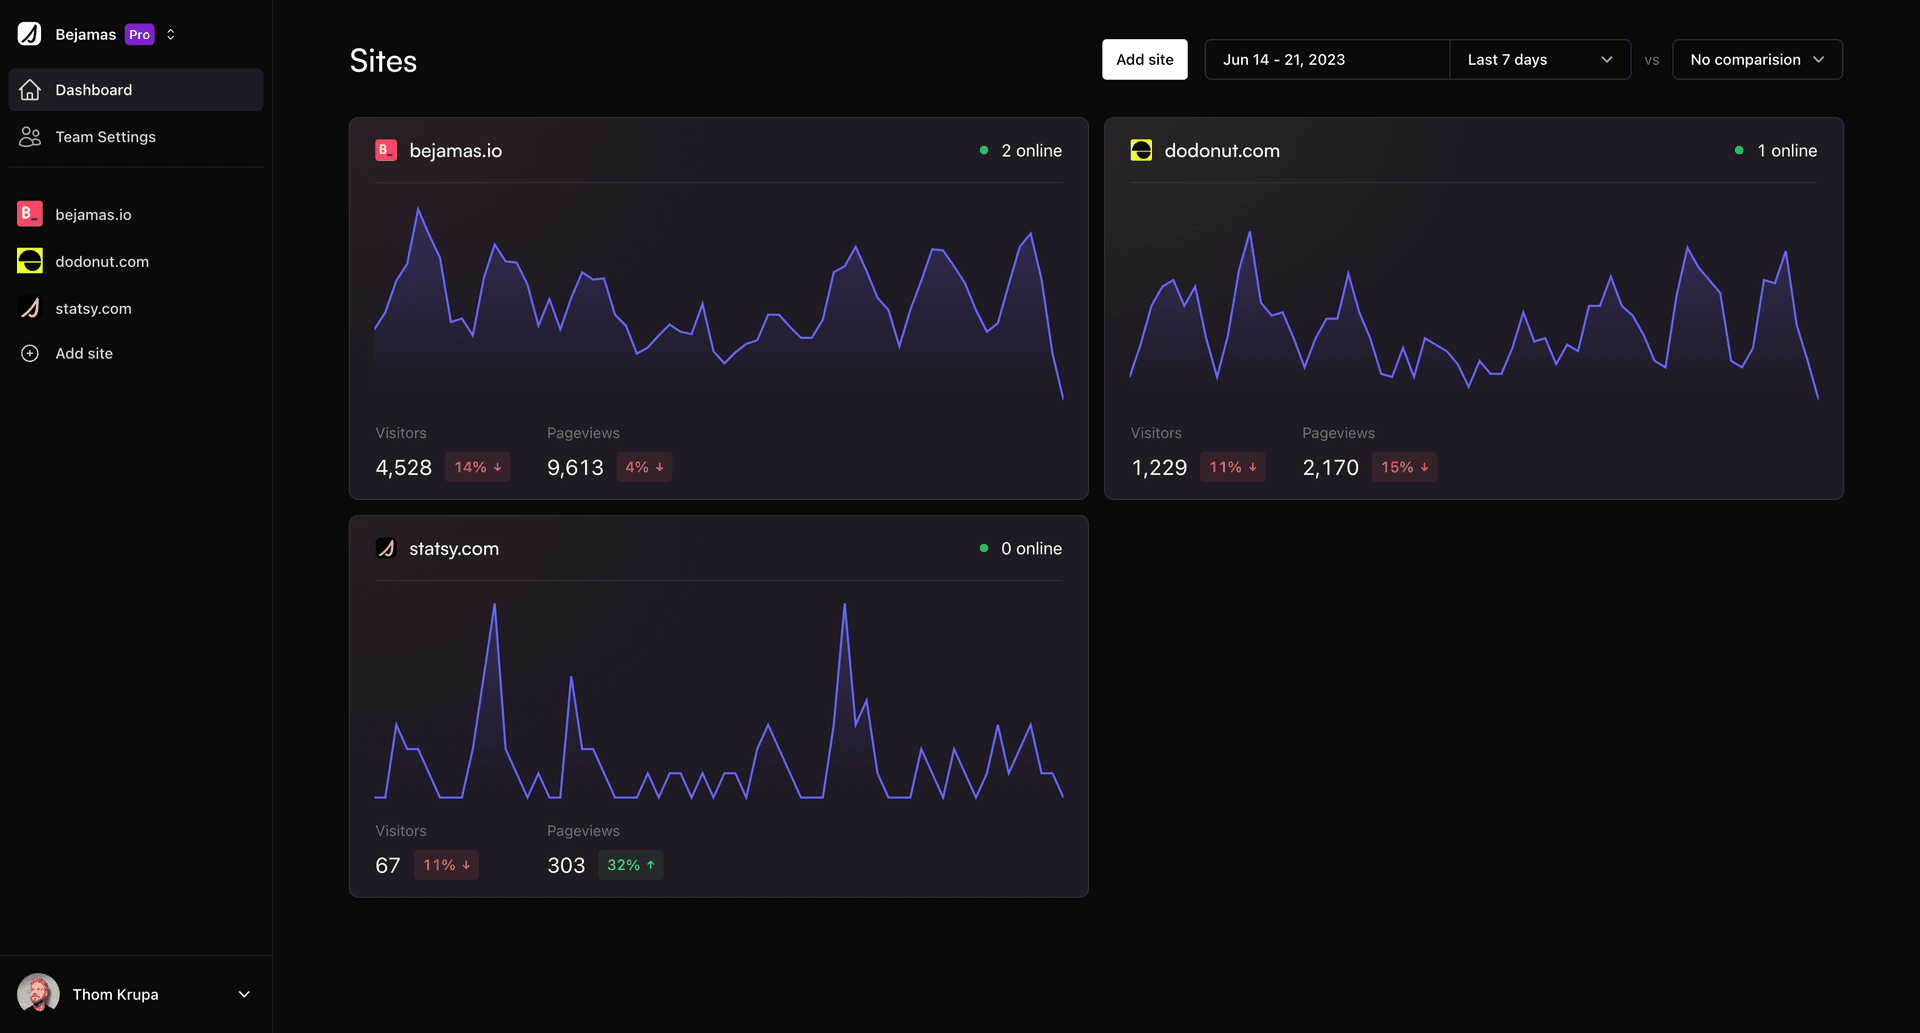
Sites
The main element of the Dashboard is the list of all sites, displaying visitors, pageviews, and a chart for each site by default for the last 7 days period. This section provides an overview of the traffic and engagement on your sites, allowing you to quickly compare their performance and identify trends or issues.
Controls
Left Panel

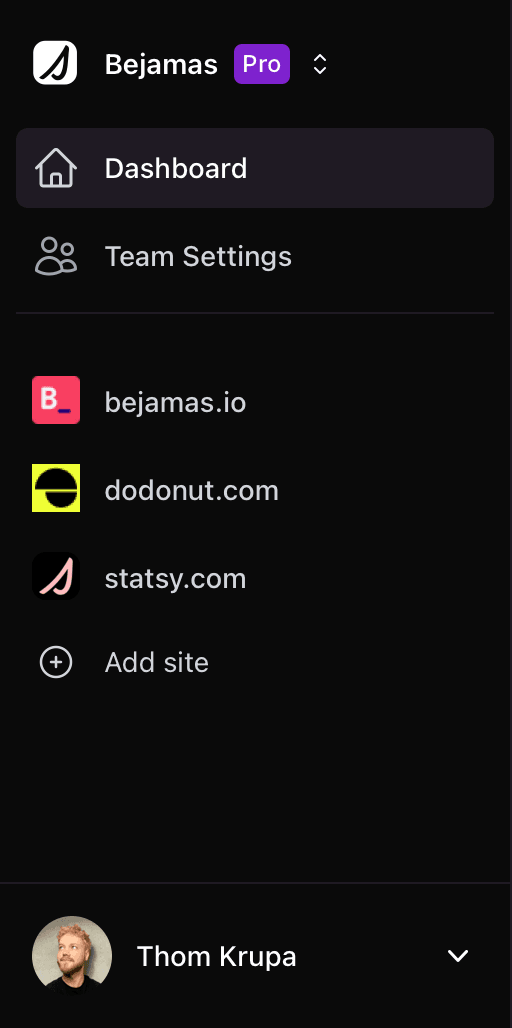
The left panel of the Dashboard contains various navigation and management options:

- Dashboard: Takes you to the main Dashboard Overview.
- Team Settings: Provides access to the settings for your current team, including general settings, members, billing, and invoices.
- List of all sites: Displays all the sites within the current team scope, allowing for easy navigation and analysis.
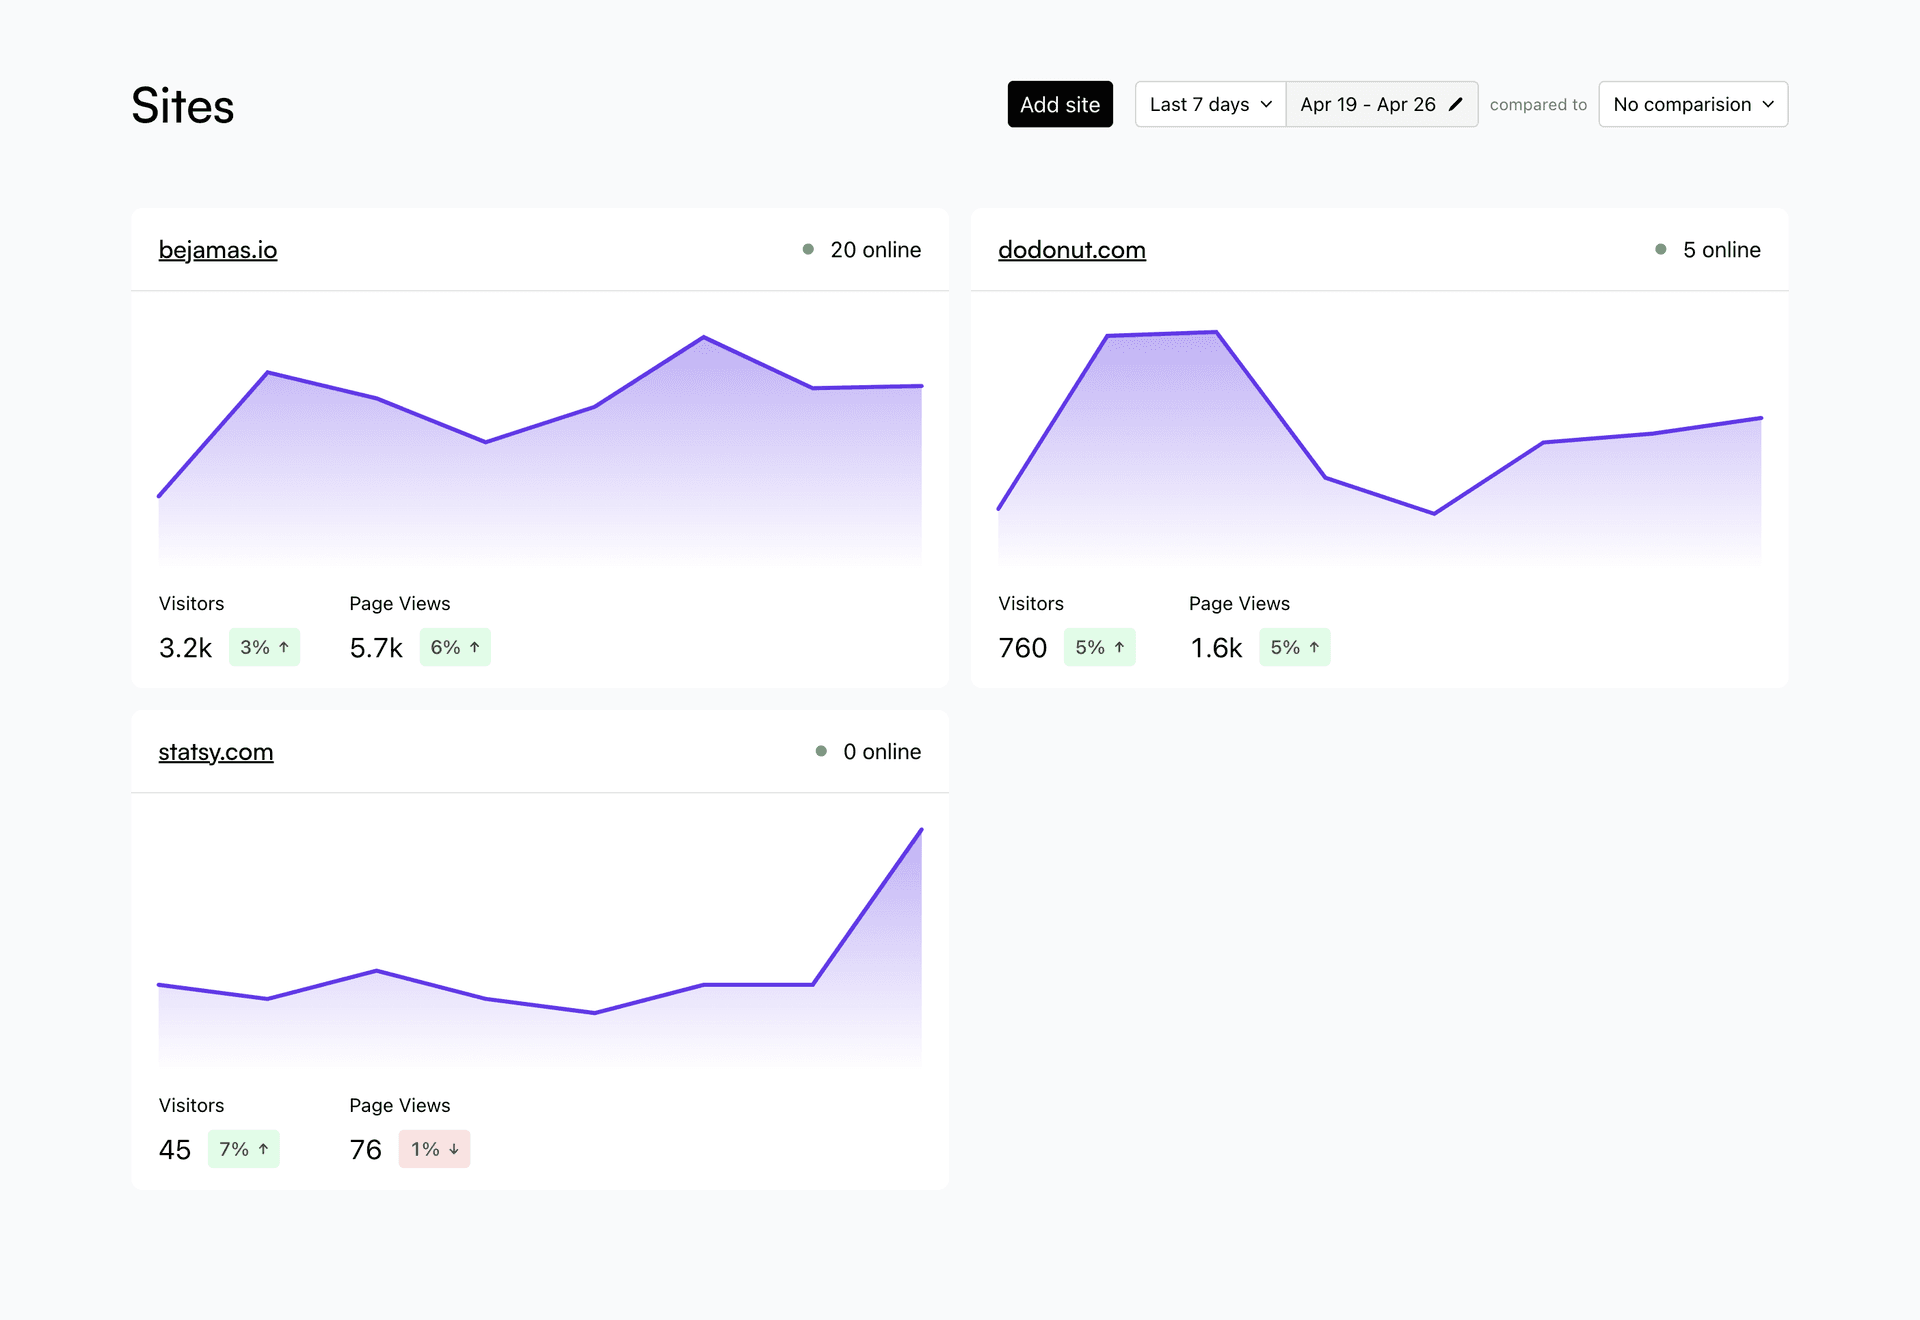
Top right
In the top right corner of the Dashboard, you'll find several controls:
- Add Site button: Allows you to add a new site to your team.
- Date range filters: Lets you select the date range for the displayed data. You can choose from predefined ranges or set a custom date range.
- Comparison filter: Enables you to compare data across two periods, providing insights into changes and trends over time.
By familiarizing yourself with the Statsy Dashboard, you can effectively monitor and analyze your sites' performance, identify areas for improvement, and make informed decisions to optimize your web presence.