Site Performance
Web Vitals are a set of metrics that measure the user experience of a web page. They are designed to help site owners understand how users perceive the performance of their pages and to provide guidance on how to improve user experience.
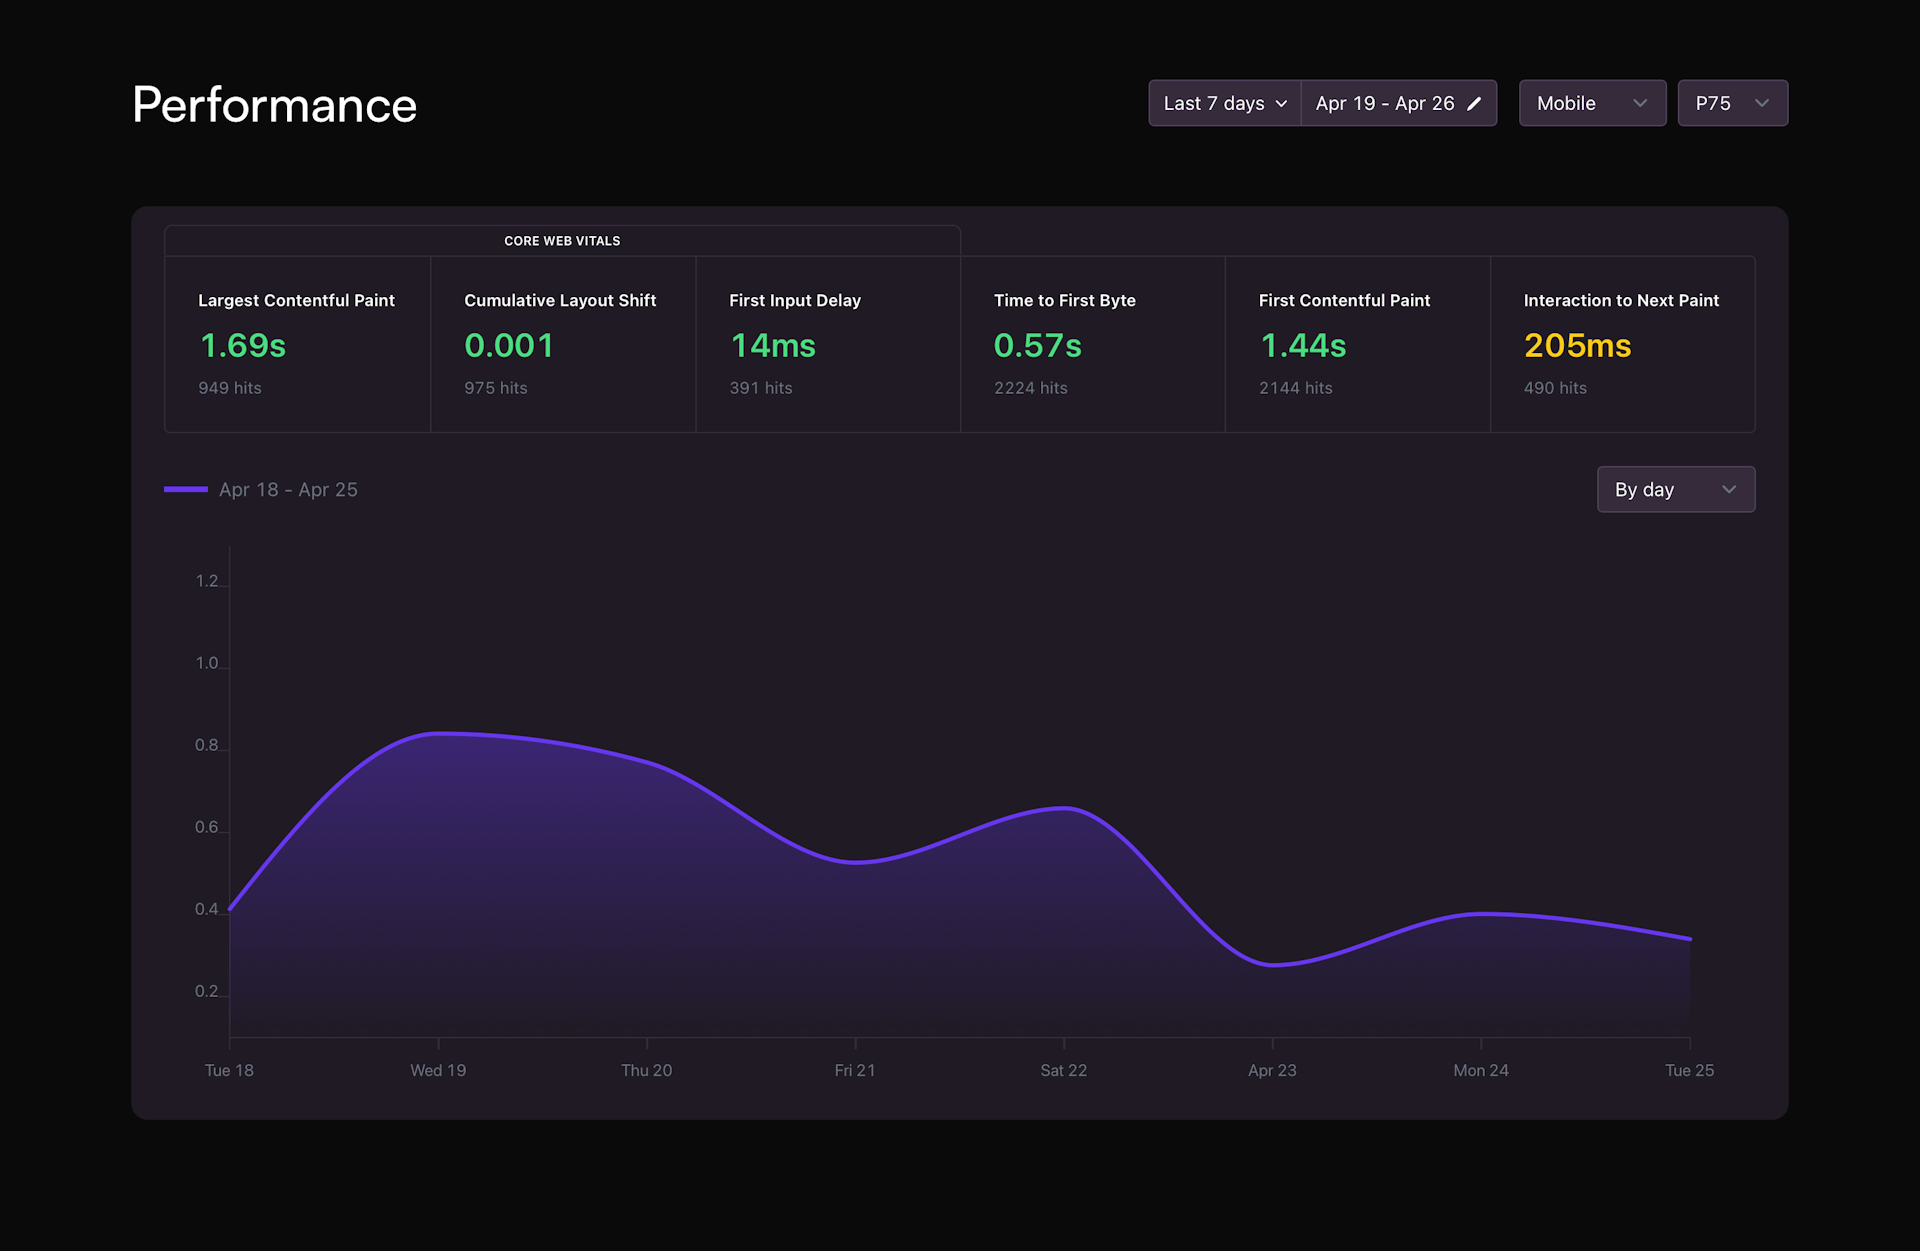
The Site Performance tab in Statsy provides an in-depth look at your website's performance by focusing on Web Vitals. These metrics measure the user experience of a web page, helping you understand how users perceive your website's performance and providing guidance on how to improve their experience.
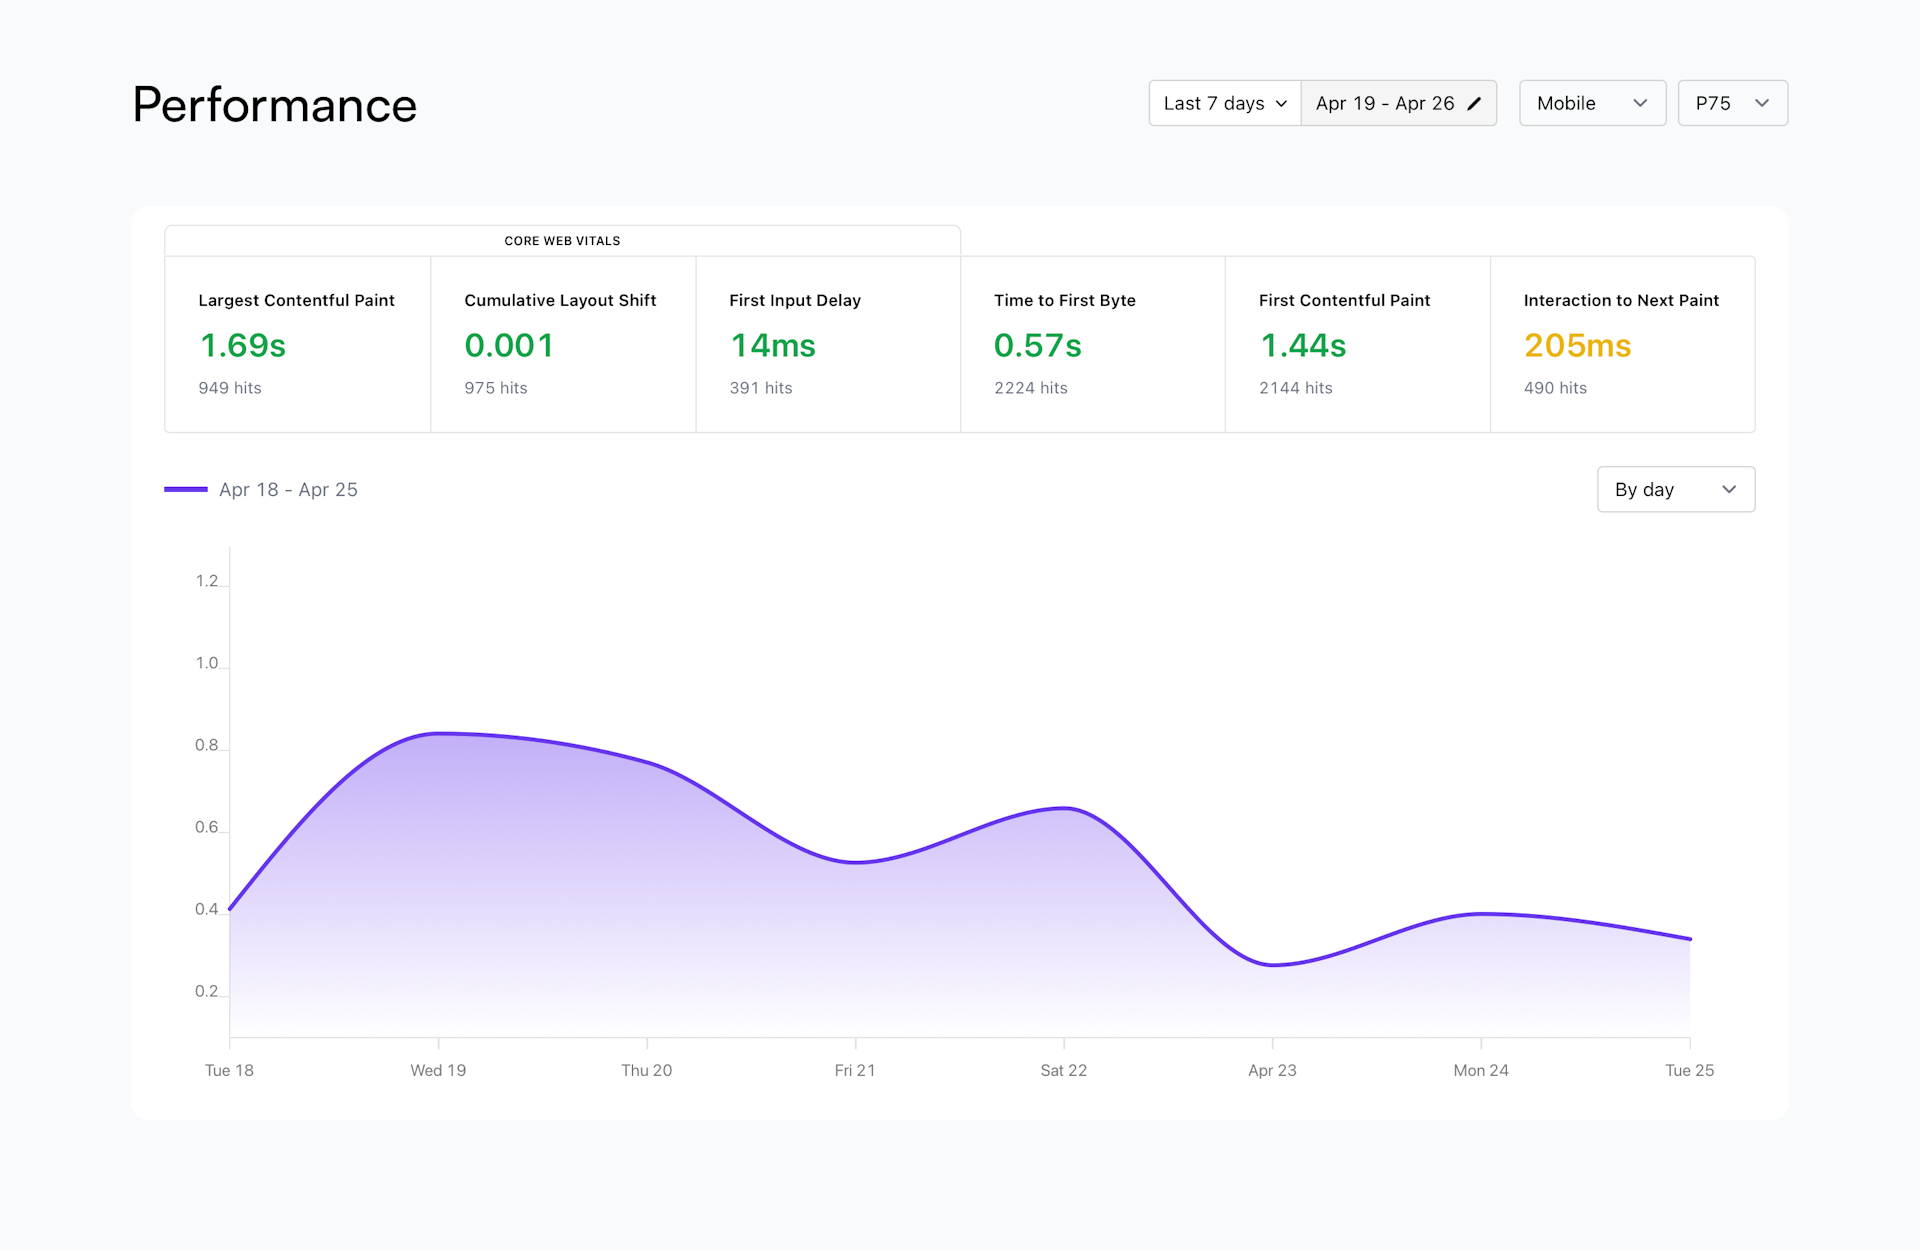
Core Web Vitals
Core Web Vitals are a subset of Web Vitals that are critical to providing a great user experience. They include:
Largest Contentful Paint (LCP)
LCP measures the time it takes for the largest content element (e.g., an image or text block) to become visible on the page. A good LCP score indicates that the page loads quickly, providing a better user experience.
First Input Delay (FID)
FID measures the time between a user's first interaction with a page (e.g., clicking a link or button) and the browser's response to that interaction. A low FID score ensures that the page is responsive to user input, resulting in a more seamless user experience.
Cumulative Layout Shift (CLS)
CLS measures the visual stability of a page by quantifying the frequency and magnitude of unexpected layout shifts. A low CLS score indicates that the page's layout is stable, preventing users from experiencing disruptive shifts in content as the page loads.
Other Web Vitals
In addition to the Core Web Vitals, Statsy also tracks other important metrics that contribute to your website's performance:
Time To First Byte (TTFB)
TTFB measures the time it takes for the browser to receive the first byte of data from the server when requesting a page. A low TTFB indicates that the server is responding quickly to requests, leading to faster page load times.
First Contentful Paint (FCP)
FCP measures the time it takes for the browser to render the first piece of content (e.g., text or image) on the page. A good FCP score means that users can start consuming content quickly, improving their overall experience.
Interaction to Next Paint (INP)
INP measures the time between a user's interaction with the page and the next paint event (e.g., content update or layout change) in the browser. A low INP score ensures that users receive timely visual feedback when interacting with the page, leading to a smoother user experience.
By monitoring Web Vitals in the Site Performance tab, you can gain a comprehensive understanding of your website's performance and identify areas for improvement. Use these insights to enhance your website's user experience and drive better results for your online business.
Web Vitals Score Calculation
Each metric is assigned a score based on specific thresholds. These scores are then used to categorize your website's performance into three categories: Good, Mid, and Poor. Understanding these scores will help you identify areas that require improvement and ensure an optimized user experience.
The table below outlines the thresholds used for each Web Vitals metric:
| Web Vital | Good | Mid | Poor |
|---|---|---|---|
| Largest Contentful Paint (LCP) | < 2500 ms | 2500 - 4000 ms | > 4000 ms |
| First Input Delay (FID) | < 100 ms | 100 - 300 ms | > 300 ms |
| Cumulative Layout Shift (CLS) | < 0.1 | 0.1 - 0.25 | > 0.25 |
| Time To First Byte (TTFB) | < 800 ms | 800 - 1800 ms | > 1800 ms |
| First Contentful Paint (FCP) | < 1800 ms | 1800 - 3000 ms | > 3000 ms |
| Interaction to Next Paint (INP) | < 200 ms | 200 - 500 ms | > 500 ms |
Filtering
You can set the percentile in the filters, located in the top right below the header. You can choose device and percentile.
Percentiles Calculation
Statsy calculates percentiles for various Web Vitals metrics to help you better understand your website's performance. Percentiles are a statistical measure that indicates the relative standing of a specific value within a dataset. In the context of Web Vitals, percentiles help identify the performance experienced by a certain percentage of your users.
You can choose from four different percentiles in Statsy: P75, P90, P95, and P99. By default, the P75 percentile is displayed. The P75 percentile represents the value below which 75% of the data points fall, meaning that 75% of your users experience performance at or better than the P75 value.
By using percentiles, you can better understand the distribution of performance experienced by your users and identify areas that require optimization. Keep in mind that improving the performance for higher percentiles (such as P90 or P95) will generally have a more significant impact on overall user experience, as it addresses the performance issues faced by a larger portion of your audience.